

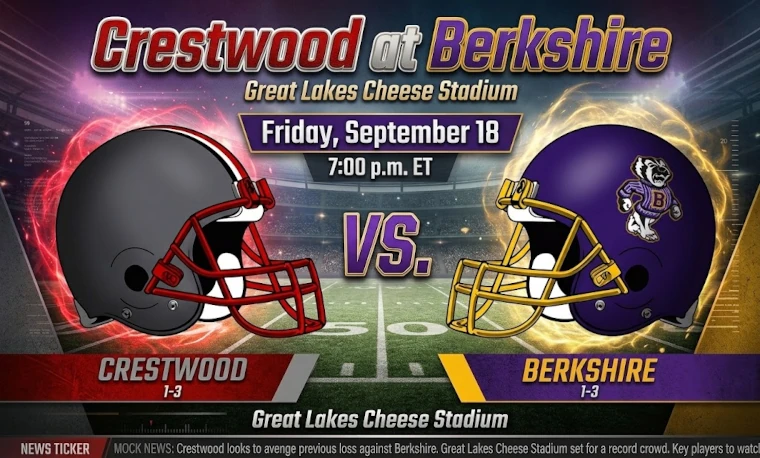

Crestwood finally found the offensive breakthrough it had been looking for last week. Berkshire already has one dominant victory on its résumé but is trying to rebound from a tough league-opening loss.
On Friday night, one of them gets a chance to turn a 1-3 start into something more promising.
Crestwood Football travels to Berkshire Football for a 7 p.m. Chagrin Valley Conference Valley Division matchup between two longtime opponents with plenty at stake.
A series that has swung both ways
Berkshire leads the all-time series 9-8, but the history between these teams has come in waves.
The Badgers won the first five meetings from 1982-95 before Crestwood ripped off six straight victories from 1996-2000. The rivalry returned to the schedule in 2020, and Crestwood won the first three meetings of that stretch, including a 22-21 victory in the opening round of the 2021 playoffs.
Help Ohio Varsity Tell More Stories
Ohio Varsity is independently owned and provides local coverage of high school athletes, teams and communities throughout Northeast Ohio.
One-time and monthly donations available through PayPal.
Since then, Berkshire has taken control.
The Badgers have won four straight regular-season meetings, including a 36-8 victory last fall. Berkshire also won 42-8 in 2022, 35-24 in 2023, and 23-14 in 2024.
Friday’s date comes with its own piece of history.
Crestwood is 7-1 all-time in games played on Sept. 18, while Berkshire is 4-3. Two of those Sept. 18 games came against each other, and Crestwood won both — 30-13 in 1998 and 42-28 in 2020.
Crestwood breaks through
The Red Devils enter Friday at 1-3 but are coming off by far their best offensive showing of the season, a 53-8 win over Independence. Crestwood opened with losses to Mogadore, Garfield and Mineral Ridge before breaking through in Week 4.
The running game gives Crestwood several options.
Sophomore Nick Hess leads the way with 400 yards and four touchdowns on 41 carries, an average of nearly 10 yards per attempt. Junior Michael Kalista has rushed 53 times for 375 yards and three scores while also handling the bulk of the quarterback duties.
Junior Chris Mory has been just as efficient, turning 36 carries into 339 yards and four touchdowns.
Together, Hess, Kalista and Mory have accounted for 1,114 rushing yards and 11 touchdowns, giving the Red Devils three proven options on the ground.
Mory also has been one of Crestwood’s defensive leaders with 31 tackles, while senior James Lancaster has recorded 25 tackles.
Badgers looking to rebound
Berkshire’s 1-3 record has followed a different path.
The Badgers opened with a 27-22 loss at Harvey and fell 31-7 to Cuyahoga Heights before erupting for a 56-0 victory at Cardinal. Last week, Berkshire went on the road and stayed within striking distance of unbeaten Conneaut before falling 21-12.
Senior Oliver Miller gives Berkshire a dual-threat option at quarterback. Miller has completed 32 of 59 passes for 408 yards and seven touchdowns and has added 139 rushing yards and three scores.
Sophomore Trent Holland has contributed on both sides of the ball with 70 rushing yards and a touchdown along with 17 tackles and a sack. Brice Walker has added a rushing touchdown and an interception defensively.
Early Valley Division stakes
Friday also carries early significance in the Valley Division race.
Berkshire is 0-1 in division play after its loss to Conneaut, while Crestwood enters its first Valley Division game. Conneaut, Chagrin Falls and Kirtland each won their league openers last week, leaving the Badgers with an opportunity to avoid an 0-2 start and the Red Devils with a chance to enter the race at 1-0.
Both teams also have ground to make up in the Division V, Region 17 playoff picture. Through Week 4, Crestwood sits 20th in the unofficial Harbin rankings with a 1.6750 average, while Berkshire is 25th at 0.8750. The top 12 teams in the region after Week 10 qualify for the postseason.
Something has to give
Crestwood arrives with a three-headed running attack coming off a 53-point night. Berkshire has won the last four regular-season meetings and gets this one at home.
The Badgers are trying to keep their recent control of the series intact. The Red Devils are trying to build on their first win of the season and continue a curious bit of Sept. 18 history that has treated them very well.
One way or another, a remarkably close 9-8 series is about to add another chapter.
More Football Coverage From OhioVarsity.com


Hudl has not provided an embeddable broadcast ID for this link.
Why the Predictor Favors Berkshire
Berkshire carries a 73% modeled win probability because Current season favors Berkshire; Recent head-to-head favors Berkshire; Home field favors Berkshire. The model refreshes as new results are entered.
The Ohio Varsity Matchup Predictor™ uses the previous three seasons as an early program-strength baseline, then shifts weight toward current-season record and PF/PA as results accumulate. Recent head-to-head results, strength of schedule, momentum and the longer recorded series provide additional context. An unfollowed team's missing data remains neutral instead of erasing known information about its opponent. Home field receives a small adjustment. Predicted score and win probability are editorial estimates, not betting lines.
Historical Notes
Berkshire Win
- Berkshire has now won its 5th straight against Crestwood.
- Berkshire is now 85-26-1 when scoring 21-30 points since 1972.
Other Statistical Notes
- This is the 18th recorded meeting between Crestwood and Berkshire since 1972.
- Series: Crestwood is 8-10 against Berkshire since 1972; average score 24.2-23.2.
- Crestwood's largest recorded win in the series: Sep. 10, 1999 • 71-7.
- Highest-scoring meeting: Sep. 10, 1999 • 71-7.
- Series shutouts since 1972: Crestwood 0, Berkshire 1.
Program Milestones
- Crestwood has recorded 60 shutouts since 1972; the most recent was Aug. 30, 2024.
- Crestwood has scored 40+ points 75 times since 1972 (most recently Sep. 11, 2026).
- The program has reached 50+ points 24 times since 1972 (most recently Sep. 11, 2026).
- Berkshire has recorded 66 shutouts since 1972; the most recent was Sep. 4, 2026.
- Berkshire has scored 40+ points 81 times since 1972 (most recently Sep. 4, 2026).
- The program has reached 50+ points 28 times since 1972 (most recently Sep. 4, 2026).
Record by Points Scored
Program record in games falling within each scoring range.
Crestwood scoring history
Berkshire scoring history
Crestwood Results vs. Berkshire
| Date | Location | Score |
|---|---|---|
| Sep. 18, 2026 | Berkshire | Crestwood L 21-28 |
| Oct. 10, 2025 | — | Crestwood L 8-36 |
| Oct. 11, 2024 | — | Crestwood L 14-23 |
| Oct. 6, 2023 | — | Crestwood L 24-35 |
| Sep. 23, 2022 | Great Lakes Cheese Stadium | Crestwood L 8-42 |
| Oct. 30, 2021 | — | Crestwood W 22-21 |
| Sep. 24, 2021 | — | Crestwood W 50-7 |
| Sep. 18, 2020 | — | Crestwood W 42-28 |
| Sep. 8, 2000 | — | Crestwood W 41-6 |
| Sep. 10, 1999 | — | Crestwood W 71-7 |
| Sep. 18, 1998 | — | Crestwood W 30-13 |
| Sep. 12, 1997 | — | Crestwood W 52-18 |
| Sep. 13, 1996 | — | Crestwood W 17-12 |
| Sep. 22, 1995 | — | Crestwood L 10-14 |
| Sep. 23, 1994 | — | Crestwood L 7-38 |
| Sep. 24, 1993 | — | Crestwood L 13-31 |
| Sep. 2, 1983 | — | Crestwood L 6-28 |
| Sep. 3, 1982 | — | Crestwood L 0-30 |
Historical Data: Series records shown here cover 1972 through the latest imported season. Earlier meetings may not be included.
Top Performers
Crestwood
Berkshire
Crestwood — Last 5 vs. Berkshire
Crestwood vs. Berkshire Series Notes
Latest meeting: Sep. 18, 2026 • Crestwood L 21-28
First recorded meeting: Sep. 3, 1982
Crestwood longest winning streak: W 8
Berkshire longest winning streak: W 5
Largest Crestwood win: Sep. 10, 1999 • 71-7
Highest-scoring game: Sep. 10, 1999 • 71-7
Closest game: Oct. 30, 2021 • 22-21
Average score: Crestwood 24.2 • Berkshire 23.2
Team Stats
| Stat Category | Crestwood | Berkshire |
|---|---|---|
| Passing | ||
| Yards | 434 | 1361 |
| Comp-Att | 31-76 | 82-152 |
| Comp % | 40.8% | 53.9% |
| Yards/Att | 5.7 | 9.0 |
| TD / INT | 0 / 4 | 16 / 6 |
| Rushing | ||
| Yards | 3002 | 1574 |
| Attempts | 406 | 334 |
| Yards/Carry | 7.4 | 4.7 |
| Touchdowns | 27 | 23 |
| Receiving | ||
| Yards | 480 | 1361 |
| Receptions | 79 | 82 |
| Yards/Catch | 6.1 | 16.6 |
| Touchdowns | 0 | 713 |
| Defense | ||
| Tackles | 613 | 131 |
| Sacks | 9 | 14 |
| Interceptions | 2 | 1 |
| Scoring | ||
| Points | 170 | 0 |
Player Stats
Crestwood Stats (2026-2027)
| # | Player | CMP | ATT | PCT | YDS | Y/G | TD | INT | LONG | QB RTG |
|---|---|---|---|---|---|---|---|---|---|---|
| 3 | Michael Kalista | 29 | 71 | 40.8% | 406 | 20.3 | 0 | 2 | 20 | 0.0 |
| 80 | Landon Fehrenbach | 1 | 2 | 50.0% | 25 | 8.3 | 0 | 1 | 0 | 0.0 |
| 22 | Chris Mory | 1 | 3 | 33.3% | 3 | 0.5 | 0 | 1 | 0 | 0.0 |
| # | Player | ATT | YDS | AVG | Y/G | LONG | TD |
|---|---|---|---|---|---|---|---|
| 21 | Nick Hess | 133 | 1,072 | 11.0 | 91.3 | 63 | 10 |
| 3 | Michael Kalista | 132 | 872 | 7.5 | 82.3 | 79 | 9 |
| 22 | Chris Mory | 98 | 806 | 5.7 | 57.0 | 23 | 7 |
| 19 | Xaden Beverly | 26 | 183 | 4.3 | 5.7 | 11 | 1 |
| 4 | James Lancaster | 11 | 60 | 6.2 | 12.3 | 16 | 0 |
| 80 | Landon Fehrenbach | 2 | 5 | 4.0 | 2.0 | 0 | 0 |
| 31 | Nykko Stryczny | 3 | 5 | 1.7 | 1.0 | 0 | 0 |
| 13 | Lucas Stoots | 1 | -1 | -1.0 | -0.5 | 0 | 0 |
| # | Player | REC | YDS | AVG | Y/G | LONG | TD |
|---|---|---|---|---|---|---|---|
| 22 | Chris Mory | 13 | 134 | 10.3 | 14.7 | 2 | 0 |
| 8 | Jake Devlin | 5 | 107 | 21.4 | 15.3 | 0 | 0 |
| 9 | Tye Berquist | 3 | 73 | 24.3 | 10.4 | 1 | 0 |
| 21 | Nick Hess | 4 | 39 | 9.8 | 5.6 | 0 | 0 |
| 19 | Xaden Beverly | 3 | 34 | 11.3 | 4.3 | 0 | 0 |
| 4 | James Lancaster | 2 | 28 | 14.0 | 3.5 | 1 | 0 |
| 3 | Michael Kalista | 23 | 23 | 1.0 | 2.9 | 1 | 0 |
| 5 | Tyler Devlin | 1 | 17 | 17.0 | 5.7 | 0 | 0 |
| 44 | Josiah Baker | 7 | 7 | 1.0 | 1.8 | 0 | 0 |
| 38 | Gio Brock | 5 | 5 | 1.0 | 1.3 | 0 | 0 |
| 31 | Nykko Stryczny | 4 | 4 | 1.0 | 0.8 | 0 | 0 |
| 65 | Josh Hardt | 3 | 3 | 1.0 | 3.0 | 0 | 0 |
| 80 | Landon Fehrenbach | 2 | 2 | 1.0 | 0.7 | 0 | 0 |
| 74 | Cade Honeycutt | 1 | 1 | 1.0 | 0.5 | 0 | 0 |
| 52 | Clayton Mullins | 1 | 1 | 1.0 | 1.0 | 0 | 0 |
| 10 | Everett Baynes | 1 | 1 | 1.0 | 0.3 | 0 | 0 |
| 35 | Owen Overfield | 1 | 1 | 1.0 | 0.1 | 0 | 0 |
| # | Player | RUSH | REC | KR | PR | IR | TOTAL | Y/G |
|---|---|---|---|---|---|---|---|---|
| 21 | Nick Hess | 1,072 | 39 | 130 | 0 | 0 | 1,241 | 177.3 |
| 22 | Chris Mory | 806 | 134 | 170 | 60 | 0 | 1,170 | 195.0 |
| 3 | Michael Kalista | 872 | 23 | 0 | 0 | 0 | 895 | 111.9 |
| 19 | Xaden Beverly | 183 | 34 | 5 | 0 | 0 | 222 | 27.8 |
| 9 | Tye Berquist | 0 | 73 | 109 | 0 | 0 | 182 | 26.0 |
| 4 | James Lancaster | 60 | 28 | 83 | 0 | 0 | 171 | 21.4 |
| 8 | Jake Devlin | 0 | 107 | 0 | 0 | 0 | 107 | 15.3 |
| 38 | Gio Brock | 0 | 5 | 38 | 0 | 0 | 43 | 10.8 |
| 5 | Tyler Devlin | 0 | 17 | 10 | 0 | 0 | 27 | 4.5 |
| 31 | Nykko Stryczny | 5 | 4 | 0 | 0 | 0 | 9 | 1.8 |
| 44 | Josiah Baker | 0 | 7 | 0 | 0 | 0 | 7 | 1.8 |
| 80 | Landon Fehrenbach | 5 | 2 | 0 | 0 | 0 | 7 | 2.3 |
| 65 | Josh Hardt | 0 | 3 | 0 | 0 | 0 | 3 | 3.0 |
| 74 | Cade Honeycutt | 0 | 1 | 0 | 0 | 0 | 1 | 0.5 |
| 52 | Clayton Mullins | 0 | 1 | 0 | 0 | 0 | 1 | 1.0 |
| 10 | Everett Baynes | 0 | 1 | 0 | 0 | 0 | 1 | 0.3 |
| 35 | Owen Overfield | 0 | 1 | 0 | 0 | 0 | 1 | 0.1 |
| 13 | Lucas Stoots | -1 | 0 | 0 | 0 | 0 | -1 | -0.5 |
| # | Player | RUSH | PASS | REC | TOTAL | Y/G |
|---|---|---|---|---|---|---|
| 3 | Michael Kalista | 872 | 406 | 23 | 1,301 | 162.6 |
| 21 | Nick Hess | 1,072 | 0 | 39 | 1,111 | 158.7 |
| 22 | Chris Mory | 806 | 3 | 134 | 943 | 157.2 |
| 19 | Xaden Beverly | 183 | 0 | 34 | 217 | 27.1 |
| 8 | Jake Devlin | 0 | 0 | 107 | 107 | 15.3 |
| 4 | James Lancaster | 60 | 0 | 28 | 88 | 11.0 |
| 9 | Tye Berquist | 0 | 0 | 73 | 73 | 10.4 |
| 80 | Landon Fehrenbach | 5 | 25 | 2 | 32 | 10.7 |
| 5 | Tyler Devlin | 0 | 0 | 17 | 17 | 2.8 |
| 31 | Nykko Stryczny | 5 | 0 | 4 | 9 | 1.8 |
| 44 | Josiah Baker | 0 | 0 | 7 | 7 | 1.8 |
| 38 | Gio Brock | 0 | 0 | 5 | 5 | 1.3 |
| 65 | Josh Hardt | 0 | 0 | 3 | 3 | 3.0 |
| 74 | Cade Honeycutt | 0 | 0 | 1 | 1 | 0.5 |
| 52 | Clayton Mullins | 0 | 0 | 1 | 1 | 1.0 |
| 10 | Everett Baynes | 0 | 0 | 1 | 1 | 0.3 |
| 35 | Owen Overfield | 0 | 0 | 1 | 1 | 0.1 |
| # | Player | TD | 2-PT PTS | KICK PTS | PTS | PPG |
|---|---|---|---|---|---|---|
| 21 | Nick Hess | 0 | 0 | 0 | 60 | 8.6 |
| 3 | Michael Kalista | 0 | 0 | 0 | 54 | 6.8 |
| 22 | Chris Mory | 0 | 0 | 0 | 42 | 7.0 |
| 35 | Owen Overfield | 0 | 0 | 8 | 8 | 1.0 |
| 19 | Xaden Beverly | 0 | 0 | 0 | 6 | 0.8 |
| # | Player | SOLO | AST | TOTAL | TFL | SACK |
|---|---|---|---|---|---|---|
| 22 | Chris Mory | 0.0 | 0.0 | 120.0 | 1.0 | 1.0 |
| 4 | James Lancaster | 0.0 | 0.0 | 90.0 | 4.0 | 0.0 |
| 3 | Michael Kalista | 0.0 | 0.0 | 77.0 | 4.0 | 0.0 |
| 19 | Xaden Beverly | 0.0 | 0.0 | 50.0 | 7.0 | 3.0 |
| 9 | Tye Berquist | 0.0 | 0.0 | 44.0 | 4.0 | 2.0 |
| 44 | Josiah Baker | 0.0 | 0.0 | 36.0 | 0.0 | 0.0 |
| 21 | Nick Hess | 0.0 | 0.0 | 31.0 | 1.0 | 0.0 |
| 10 | Everett Baynes | 0.0 | 0.0 | 29.0 | 0.0 | 0.0 |
| 31 | Nykko Stryczny | 0.0 | 0.0 | 26.0 | 3.0 | 2.0 |
| 5 | Tyler Devlin | 0.0 | 0.0 | 26.0 | 0.0 | 0.0 |
| 38 | Gio Brock | 0.0 | 0.0 | 19.0 | 0.0 | 0.0 |
| 8 | Jake Devlin | 0.0 | 0.0 | 19.0 | 0.0 | 0.0 |
| 65 | Josh Hardt | 0.0 | 0.0 | 12.0 | 0.0 | 1.0 |
| 51 | Ethan Marshall | 0.0 | 0.0 | 8.0 | 0.0 | 0.0 |
| 72 | Chase Thompson | 0.0 | 0.0 | 4.0 | 0.0 | 0.0 |
| 80 | Landon Fehrenbach | 0.0 | 0.0 | 4.0 | 0.0 | 0.0 |
| 55 | Trent Forson | 0.0 | 0.0 | 4.0 | 0.0 | 0.0 |
| 35 | Owen Overfield | 0.0 | 0.0 | 3.0 | 0.0 | 0.0 |
| 57 | Bentley Yarick | 0.0 | 0.0 | 2.0 | 0.0 | 0.0 |
| 74 | Cade Honeycutt | 0.0 | 0.0 | 2.0 | 0.0 | 0.0 |
| 77 | David Kalista | 0.0 | 0.0 | 2.0 | 0.0 | 0.0 |
| 66 | Chris Stofiel | 0.0 | 0.0 | 1.0 | 0.0 | 0.0 |
| 52 | Clayton Mullins | 0.0 | 0.0 | 1.0 | 0.0 | 0.0 |
| 60 | Gabe Heil | 0.0 | 0.0 | 1.0 | 0.0 | 0.0 |
| J. Myers | 0.0 | 0.0 | 1.0 | 0.0 | 0.0 | |
| 40 | Scott Tingler | 0.0 | 0.0 | 1.0 | 1.0 | 0.0 |
| # | Player | SACK | YDL | HUR | TACK | TFL |
|---|---|---|---|---|---|---|
| 19 | Xaden Beverly | 3.0 | 0.0 | 0.0 | 50.0 | 7.0 |
| 31 | Nykko Stryczny | 2.0 | 0.0 | 0.0 | 26.0 | 3.0 |
| 9 | Tye Berquist | 2.0 | 0.0 | 0.0 | 44.0 | 4.0 |
| 22 | Chris Mory | 1.0 | 0.0 | 0.0 | 120.0 | 1.0 |
| 65 | Josh Hardt | 1.0 | 0.0 | 0.0 | 12.0 | 0.0 |
| # | Player | INT | YDS | AVG | LONG | TD |
|---|---|---|---|---|---|---|
| 3 | Michael Kalista | 2 | 0 | 0.0 | 0 | 0 |
| # | Player | FGM | FGA | FG% | LONG | XPM | XPA | XP% | PTS |
|---|---|---|---|---|---|---|---|---|---|
| 35 | Owen Overfield | 0 | 1 | 0.0% | 0 | 8 | 10 | 100.0% | 8 |
| # | Player | PUNTS | YDS | AVG | Y/G | IN 20 | LONG |
|---|---|---|---|---|---|---|---|
| 4 | James Lancaster | 29 | 1,142 | 41.6 | 142.8 | 0 | 57 |
| 8 | Jake Devlin | 5 | 197 | 39.4 | 65.7 | 0 | 47 |
| # | Player | RET | YDS | AVG | Y/G | TD | LONG |
|---|---|---|---|---|---|---|---|
| 22 | Chris Mory | 8 | 170 | 14.0 | 4.7 | 0 | 14 |
| 21 | Nick Hess | 4 | 130 | 32.5 | 8.7 | 0 | 62 |
| 9 | Tye Berquist | 7 | 109 | 15.2 | 26.3 | 0 | 20 |
| 4 | James Lancaster | 7 | 83 | 11.9 | 10.4 | 0 | 0 |
| 38 | Gio Brock | 3 | 38 | 12.7 | 17.5 | 0 | 25 |
| 5 | Tyler Devlin | 1 | 10 | 10.0 | 1.7 | 0 | 10 |
| 19 | Xaden Beverly | 2 | 5 | 2.5 | 0.6 | 0 | 5 |
| # | Player | RET | YDS | AVG | Y/G | TD | LONG |
|---|---|---|---|---|---|---|---|
| 22 | Chris Mory | 10 | 60 | 5.3 | 3.3 | 0 | 11 |
Berkshire Stats (2026-2027)
| # | Player | CMP | ATT | PCT | YDS | Y/G | TD | INT | LONG | QB RTG |
|---|---|---|---|---|---|---|---|---|---|---|
| 2 | Oliver Miller | 78 | 137 | 56.9% | 1,290 | 143.3 | 16 | 6 | 70 | 109.4 |
| 3 | Bear Masink | 1 | 1 | 100.0% | 40 | 4.4 | 0 | 0 | 40 | 137.5 |
| 11 | Zac Smith | 3 | 13 | 23.1% | 31 | 5.2 | 0 | 0 | 25 | 39.6 |
| # | Player | ATT | YDS | AVG | Y/G | LONG | TD |
|---|---|---|---|---|---|---|---|
| 2 | Oliver Miller | 86 | 383 | 4.5 | 42.6 | 58 | 11 |
| 20 | Trenton Holland | 76 | 322 | 4.2 | 35.8 | 25 | 4 |
| 20 | Trent Holland | 73 | 313 | 4.3 | 39.1 | 25 | 3 |
| 10 | Estevon Huesca | 20 | 121 | 6.1 | 13.4 | 12 | 0 |
| 27 | Brice Walker | 7 | 119 | 17.0 | 19.8 | 80 | 2 |
| 17 | Vance Rice | 33 | 95 | 2.9 | 19.0 | 17 | 0 |
| 1 | Dasen Marker | 15 | 75 | 5.0 | 8.3 | 16 | 0 |
| 28 | Hudson Hunter | 5 | 68 | 13.6 | 8.5 | 21 | 1 |
| 88 | Dj Ashba | 8 | 66 | 8.3 | 22.0 | 36 | 1 |
| 72 | Anthony Walker | 1 | 8 | 8.0 | 0.9 | 8 | 1 |
| 48 | Ryan Demchak-Castro | 1 | 3 | 3.0 | 0.3 | 3 | 0 |
| 9 | Jacob Ulatowski | 1 | 1 | 1.0 | 0.1 | 1 | 0 |
| # | Player | REC | YDS | AVG | Y/G | LONG | TD |
|---|---|---|---|---|---|---|---|
| 1 | Dasen Marker | 33 | 511 | 15.5 | 56.8 | 60 | 5 |
| 10 | Estevon Huesca | 14 | 316 | 22.6 | 35.1 | 70 | 3 |
| 3 | Bear Masink | 14 | 181 | 12.9 | 20.1 | 61 | 3 |
| 8 | Bennett Miller | 12 | 163 | 13.6 | 18.1 | 41 | 3 |
| 48 | Ryan Demchak-Castro | 2 | 101 | 50.5 | 11.2 | 62 | 1 |
| 9 | Jacob Ulatowski | 3 | 48 | 16.0 | 5.3 | 42 | 1 |
| 20 | Trenton Holland | 1 | 39 | 39.0 | 4.3 | 39 | 0 |
| 4 | Josh Heiden | 1 | 3 | 3.0 | 0.4 | 3 | 0 |
| # | Player | RUSH | REC | KR | PR | IR | TOTAL | Y/G |
|---|---|---|---|---|---|---|---|---|
| 1 | Dasen Marker | 75 | 511 | 0 | 0 | 0 | 586 | 65.1 |
| 10 | Estevon Huesca | 121 | 316 | 0 | 0 | 0 | 437 | 48.6 |
| 2 | Oliver Miller | 383 | 0 | 0 | 0 | 0 | 383 | 42.6 |
| 20 | Trenton Holland | 322 | 39 | 0 | 0 | 0 | 361 | 40.1 |
| 20 | Trent Holland | 313 | 0 | 0 | 0 | 0 | 313 | 39.1 |
| 3 | Bear Masink | 0 | 181 | 0 | 0 | 0 | 181 | 20.1 |
| 8 | Bennett Miller | 0 | 163 | 0 | 0 | 0 | 163 | 18.1 |
| 27 | Brice Walker | 119 | 0 | 0 | 0 | 0 | 119 | 19.8 |
| 48 | Ryan Demchak-Castro | 3 | 101 | 0 | 0 | 0 | 104 | 11.6 |
| 17 | Vance Rice | 95 | 0 | 0 | 0 | 0 | 95 | 19.0 |
| 28 | Hudson Hunter | 68 | 0 | 0 | 0 | 0 | 68 | 8.5 |
| 88 | Dj Ashba | 66 | 0 | 0 | 0 | 0 | 66 | 22.0 |
| 9 | Jacob Ulatowski | 1 | 48 | 0 | 0 | 0 | 49 | 5.4 |
| 72 | Anthony Walker | 8 | 0 | 0 | 0 | 0 | 8 | 0.9 |
| 4 | Josh Heiden | 0 | 3 | 0 | 0 | 0 | 3 | 0.4 |
| # | Player | RUSH | PASS | REC | TOTAL | Y/G |
|---|---|---|---|---|---|---|
| 2 | Oliver Miller | 383 | 1,290 | 0 | 1,673 | 185.9 |
| 1 | Dasen Marker | 75 | 0 | 511 | 586 | 65.1 |
| 10 | Estevon Huesca | 121 | 0 | 316 | 437 | 48.6 |
| 20 | Trenton Holland | 322 | 0 | 39 | 361 | 40.1 |
| 20 | Trent Holland | 313 | 0 | 0 | 313 | 313.0 |
| 3 | Bear Masink | 0 | 40 | 181 | 221 | 24.6 |
| 8 | Bennett Miller | 0 | 0 | 163 | 163 | 18.1 |
| 27 | Brice Walker | 119 | 0 | 0 | 119 | 19.8 |
| 48 | Ryan Demchak-Castro | 3 | 0 | 101 | 104 | 11.6 |
| 17 | Vance Rice | 95 | 0 | 0 | 95 | 18.8 |
| 28 | Hudson Hunter | 68 | 0 | 0 | 68 | 8.5 |
| 88 | Dj Ashba | 66 | 0 | 0 | 66 | 22.0 |
| 9 | Jacob Ulatowski | 1 | 0 | 48 | 49 | 5.4 |
| 11 | Zac Smith | 0 | 31 | 0 | 31 | 5.2 |
| 72 | Anthony Walker | 8 | 0 | 0 | 8 | 0.9 |
| 4 | Josh Heiden | 0 | 0 | 3 | 3 | 0.4 |
| # | Player | SOLO | AST | TOTAL | TFL | SACK |
|---|---|---|---|---|---|---|
| 72 | Anthony Walker | 0.0 | 0.0 | 17.0 | 0.0 | 0.5 |
| 55 | Chase Bajzel | 0.0 | 0.0 | 17.0 | 0.0 | 1.5 |
| 20 | Trent Holland | 0.0 | 0.0 | 17.0 | 0.0 | 1.0 |
| 10 | Estevon Huesca | 0.0 | 0.0 | 11.0 | 0.0 | 0.0 |
| 48 | Ryan Demchak-Castro | 0.0 | 0.0 | 10.0 | 0.0 | 0.0 |
| 27 | Brice Walker | 0.0 | 0.0 | 8.0 | 0.0 | 1.0 |
| 4 | Josh Heiden | 0.0 | 0.0 | 8.0 | 0.0 | 0.0 |
| 17 | Vance Rice | 0.0 | 0.0 | 8.0 | 0.0 | 0.0 |
| 9 | Jacob Ulatowski | 0.0 | 0.0 | 7.0 | 0.0 | 0.0 |
| 44 | Bradley Sheets | 0.0 | 0.0 | 6.0 | 0.0 | 0.0 |
| 40 | Ben Pleva | 0.0 | 0.0 | 5.0 | 0.0 | 0.0 |
| 1 | Dasen Marker | 0.0 | 0.0 | 4.0 | 0.0 | 2.0 |
| 11 | Zac Smith | 0.0 | 0.0 | 4.0 | 0.0 | 1.0 |
| 60 | Aidan Andre | 0.0 | 0.0 | 2.0 | 0.0 | 0.0 |
| 3 | Bear Masink | 0.0 | 0.0 | 2.0 | 0.0 | 1.0 |
| 8 | Bennett Miller | 0.0 | 0.0 | 2.0 | 0.0 | 2.0 |
| 12 | Colton Miller Gabbard | 0.0 | 0.0 | 2.0 | 0.0 | 0.0 |
| 52 | Mason Brewster | 0.0 | 0.0 | 1.0 | 0.0 | 0.0 |
| # | Player | SACK | YDL | HUR | TACK | TFL |
|---|---|---|---|---|---|---|
| 2 | Oliver Miller | 3.0 | 18.0 | 0.0 | 0.0 | 0.0 |
| 8 | Bennett Miller | 2.0 | 12.0 | 0.0 | 2.0 | 0.0 |
| 1 | Dasen Marker | 2.0 | 12.0 | 0.0 | 4.0 | 0.0 |
| 55 | Chase Bajzel | 1.5 | 5.0 | 0.5 | 17.0 | 0.0 |
| 3 | Bear Masink | 1.0 | 6.0 | 2.0 | 2.0 | 0.0 |
| 27 | Brice Walker | 1.0 | 6.0 | 0.0 | 8.0 | 0.0 |
| 88 | Dj Ashba | 1.0 | 6.0 | 0.0 | 0.0 | 0.0 |
| 20 | Trent Holland | 1.0 | 6.0 | 0.0 | 17.0 | 0.0 |
| 11 | Zac Smith | 1.0 | 6.0 | 2.0 | 4.0 | 0.0 |
| 72 | Anthony Walker | 0.5 | 1.0 | 0.2 | 17.0 | 0.0 |
| # | Player | INT | YDS | AVG | LONG | TD |
|---|---|---|---|---|---|---|
| 27 | Brice Walker | 1 | 0 | 0.0 | 0 | 0 |
| # | Player | FGM | FGA | FG% | LONG | XPM | XPA | XP% | PTS |
|---|---|---|---|---|---|---|---|---|---|
| 10 | Estevon Huesca | 0 | 0 | 0.0% | 0 | 0 | 0 | 0.0% | 2 |
| 28 | Hudson Hunter | 0 | 0 | 0.0% | 0 | 0 | 0 | 0.0% | 1 |
| 11 | Zac Smith | 0 | 0 | 0.0% | 0 | 0 | 0 | 0.0% | 1 |
| # | Player | PUNTS | YDS | AVG | Y/G | IN 20 | LONG |
|---|---|---|---|---|---|---|---|
| 1 | Dasen Marker | 0 | 9 | 0.0 | 1.0 | 0 | 9 |


